Manufacturing
Data and AI Consulting for Manufacturers
Most plants have more data than they use and less trust in it than they need. Those two facts are related.
We connect plant-floor data to the business systems around it, so downtime, OEE and margin are questions with one answer instead of three.
The pattern
The data exists. It just does not meet anywhere.
Machines record, the ERP records, quality records. Almost nothing joins them.
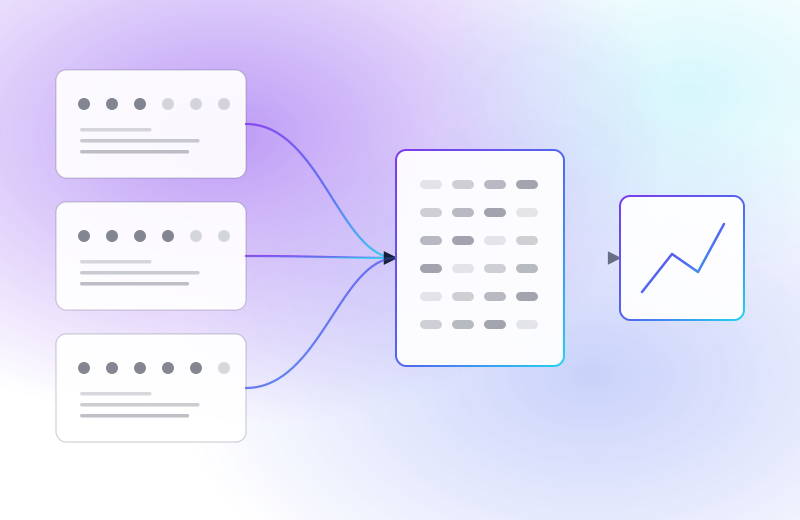
A modern plant generates a great deal of data and stores most of it. PLCs and SCADA hold machine state, the MES or the paper log holds what was run, the ERP holds what was ordered and what it cost, and the quality system holds what passed. Each is reasonably reliable about its own subject. Very little connects them, which is why questions that span two of them are answered by a person rather than a system.
That shows up as a specific and recognisable set of symptoms. OEE is reported but not trusted, because downtime reason codes are entered by whoever is nearest and nobody audits them. Two plants report the same metric differently and the comparison is quietly abandoned. Margin per product is known at a level too coarse to act on. And the maintenance team knows which machines are trouble without being able to show it.
The work is less exotic than it sounds. Before anything predictive is worth attempting, plant data has to be joined to business data at a grain both sides accept. In our experience that step alone changes more decisions than the modelling that follows it.
Published use cases
Six places manufacturers start
Documented in full in our manufacturing playbook, each with the data it requires and the conditions where it does not work.
Predictive maintenance
Machine behaviour compared against its own failure history. Needs enough recorded failures to learn from, which is the condition most often skipped when this is scoped.
Visual inspection
Automated defect detection on the line, where the defect is visible and enough labelled examples of it exist to train against.
Demand forecasting
Forecast at the level you actually place orders at, using true demand, including what you could not supply, since sales history alone understates it.
OEE and scheduling
Availability, performance and quality from machine data rather than manual entry, so the number stops being an argument and starts being a baseline.
Energy optimisation
Consumption attributed to lines, machines and products instead of to the site meter, which is where most energy questions currently stop.
Spares and inventory
What to hold, based on failure rates and lead times rather than on the reorder levels somebody set at go-live and nobody has revisited.
A question worth asking early
Buy the platform, or build on your own data
There are good arguments for each. The wrong answer is usually chosen by default rather than on merit.
| Packaged platform | Built on your own data platform | |
|---|---|---|
| Time to first result | Fast for the use cases it ships with. | Slower to first dashboard, faster to the fifth. |
| Fit to how you actually run | Good if your process matches its assumptions. Awkward where it does not. | Shaped to your process, including the parts that are unusual. |
| Joining to ERP, quality and cost data | Usually limited, and often the reason a second tool appears. | The reason it exists. |
| Multi-plant comparison | Works if every plant adopts it identically. They rarely do. | Handles plants that differ, which is the normal case. |
| Who can extend it | The vendor, on their roadmap. | Your team, or ours, on yours. |
| Honest recommendation | Right for a single site wanting OEE quickly. | Right where several sites must be compared, or cost and quality data must join. |
How engagements start
One question, answered properly
The entry point is deliberately small, and deliberately not a platform decision.
Step 1
A Health Check on the systems that matter
Two weeks. We profile what is actually in the PLC, MES, ERP and quality data rather than what the documentation claims, and write down what it will support today and what it will not.
Step 2
An OEE or downtime view the plant agrees with
Built from machine data, reconciled against what the plant team believes. Where the two disagree, that disagreement is the finding. It is usually reason codes, and usually worth more than the dashboard.
Step 3
Then one predictive use case
Chosen because the data supports it, not because it is the most impressive. Tested against history before anyone changes a maintenance schedule on the strength of it.
Being straight about it
Where predictive maintenance does not work yet
Predictive maintenance is the use case manufacturers ask for most and the one most often scoped before its conditions are met. A model learns to recognise the run-up to a failure by being shown failures. If a machine has failed twice in the recorded history, there is nothing to learn from, however good the sensor coverage is.
The other common blocker is that failures were recorded as events but not as causes, so the history says a line stopped without saying what broke. That is fixable, and fixing it is cheap compared with a modelling project built on top of it. But it takes a few months of disciplined recording before the data is worth modelling.
When we find either condition, we say so, and the honest recommendation is usually to start with condition monitoring and better failure recording, then revisit prediction in six to twelve months. That is a smaller sale for us and a considerably better outcome for the plant.
Questions we get asked
Before you commit to anything
No, and starting there is a common way to spend a year before producing anything. A great deal of value sits in joining ERP, quality and maintenance data, systems that are already reachable, and that work often reveals which plant-floor connections are actually worth making.
It is the normal case, and it is the main argument for building on your own data platform rather than adopting a packaged one. Plants that differ can still be compared, but only if the differences are modelled explicitly rather than assumed away. Pretending they are identical is what makes multi-plant reporting quietly untrustworthy.
A plant or operations leader who owns the question, someone from plant IT, and, importantly, the OT or automation engineer responsible for the production network. That last person is often engaged late and is usually the one who determines the timeline.
They frequently do, and the reason is almost always downtime reason codes rather than the calculation. Where codes are entered by hand under production pressure, the distribution tends to reflect which button is easiest to reach. Deriving availability from machine state and comparing it against the reported figure is often the most uncomfortable and most useful early output.
Yes, and for manufacturers it is frequently the centre of the engagement. We have a dedicated page on SAP data migration and S/4HANA data readiness, which is the work that most often needs to happen first.
No. The smaller the operation, the more likely the honest first answer is to fix the spreadsheet and the recording discipline rather than build a platform. We would rather tell you that than sell a project that will not repay itself.
Where to next
Related reading
Manufacturing Playbook
The six use cases in full, with the data each needs and where each one fails.
SAP Data Migration & S/4HANA Readiness
For manufacturers on ECC, this is usually the work that has to come first.
BI Automation Calculator
What manual reporting is costing you, before you decide what to do about it.